.png?width=259&name=WSAI%20Amsterdam%20Orange%20no%20dates%202000x300%20(1).png)
Until you break Apache Kafka you don't know how fragile it is. Why would you deliberately break Kafka? Because you want to learn what can go wrong and how to prevent it. When Kafka breaks in production you'll want to fix it as fast as possible. It's cheaper to invest into learning how to chaos test Kafka than it's to hire lawyers because you broke an SLA. The purpose of chaos testing is to see what happens when a service fails. Instead of assertions, chaos tests use monitoring solutions to prove correctness.
I assume you are familiar with Kafka basics because I go on to explain why it’s important to monitor a Kafka cluster. If you are unfamiliar with Kafka take a peek at Jean-Christophe Baey’s post. If you are interested in how Kafka compares to RabbitMQ see Kafka vs RabbitMQ by Dobbelaere and Esmaili.
For testing purposes, I have constructed tiny Kafka and Zookeeper Docker images (115MB). They are much smaller than other Docker images which use Oracle Java and the latest Kafka. In my next post I’ll explain how it was constructed.
Why monitor Kafka?
How do you know Kafka is working optimally? You don't and that's because no one can. The best you can do is prove the absence of faults. Faults range from temporary to those that cause a chain of failures. How do you check if there's a fault? By using a monitoring solution: a metrics collector, a database and a dashboard. You could check metrics by hand, manually querying them, but it's easier to understand graphs and gauges than text. If faults are obvious then you will act quicker and with more confidence.
Why break Kafka?
The more you try to break Kafka and fail, the more confident you are it's working correctly. You only have to worry when you successfully break Kafka and don't know how you did it. To prevent a fault you have to know its cause. Waiting for a fault to occur in production is expensive. It's better to create a controlled environment, cause a fault and then monitor what's going on. If an action reliably causes a fault you can be sure that that action is the cause. You control for other variables by creating an identical healthy Kafka cluster for each chaos test. Once you know what caused Kafka to stop working you will know how to prevent it.
How do you (safely) break Kafka?
You'll want to create an environment where you can run chaos tests in isolation, as quickly as possible. Don't let a test pollute your OS with files. If it takes too long to run or clean up after a chaos test, you will become annoyed and stop testing. Therefore, you will need a chaos framework and a monitoring solution. My tools of choice are: blockade, Dataflux's metrics collector KaSta, Graphite and Grafana. blockade orchestrates Docker containers and creates network problems while Grafana graphs metrics stored in Graphite. The script which runs the chaos test must do the following: run the container orchestra, create a network problem, output metrics, transfer metrics to Graphite and then let Grafana graph them.
Why use a custom Kafka metrics collector?
Dataflux's KaSta is a Kafka metrics collector which can send metrics either over the network or write them to a file. When KaSta monitors a production cluster it sends metrics over the network. However, that cannot be done during a chaos test. That's because blockade impedes all network traffic including attempts to send metrics. If you pull metrics over the network they will be an echo of what happened in the past, not what is going on right now. To understand what's going on under the blockade you need to get metrics without using the network which is exactly what KaSta can do.
What do you look at while Kafka is being tested?
As Graphite is being filled with metrics, make Grafana draw these metrics:
- ActiveControllerCount - value greater than one signals network partition (a.k.a. "split brain")
- IsrShrinksPerSec and IsrExpandsPerSec - more shrinks than expands signals topic partition under-replication
- UncleanLeaderElectionsPerSec - value greater than zero signals data loss
- UnderReplicatedPartitions - value greater than zero signals topic partition under-replication
For a more verbose explanation of each metric see Evan Mouzakitis’ post about monitoring Kafka.
Below is a dashboard which shows all these metrics. Can you tell when something went wrong? When did the cluster return to a healthy state?
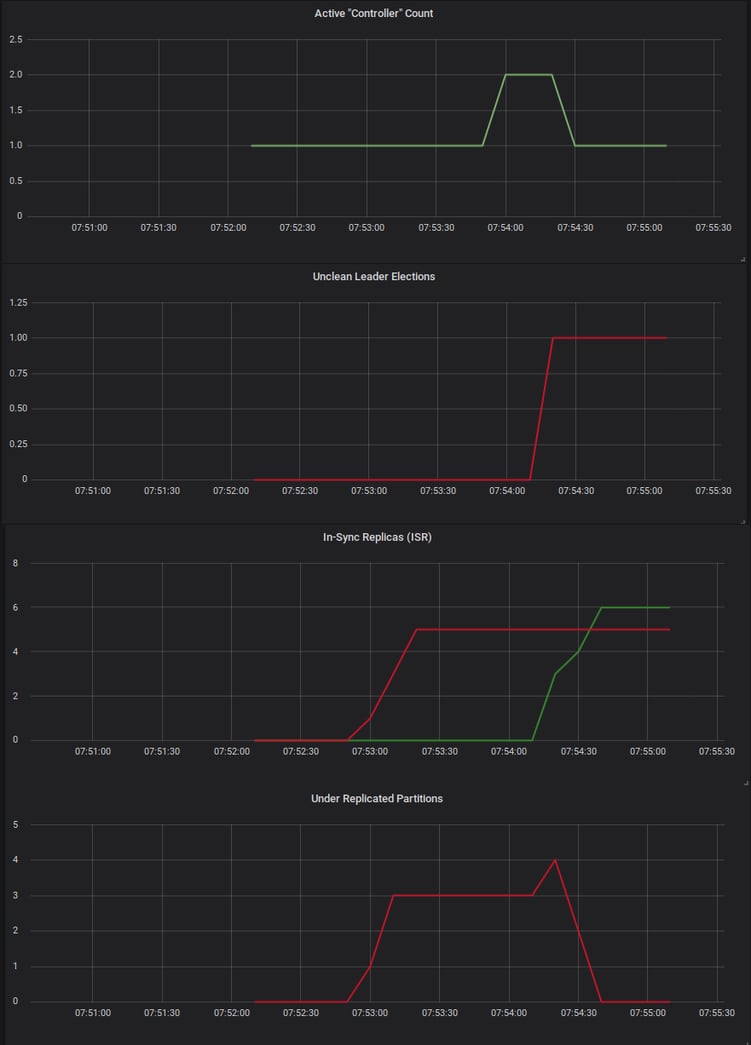
Network partition, data loss and partition under-replication can all be observed.
What can you learn from the rubble?
- With a sufficiently bad network one producer is enough to break a three broker Kafka cluster.
- A Kafka cluster can be partitioned by just isolating the controller.
- Kafka values durability over availability. An unclean election can only happen if you allow it though the settings.
- If there's an unclean election the controller will report it, not the broker who won the election.
- Something is wrong if there are more ISR shrinks than expands.
- However, you can't be sure everything is alright if there are more ISR expands than shrinks.
- Under-replicated partitions metric reliably reports a problem, but not what caused it.
Disclaimer: AISoft Technology is developing and integrating solutions for DataFlux GmbH
Join DataFlux and the entire AI community at this year's World Summit AI in Amsterdam. View the full programme, speaker line up and book tickets by visiting worldummit.ai
World Summit AI 2019
October 9th-10th
Amsterdam, Netherlands
worldsummit.ai